~/blog/homelab-soc-log-pipeline
Building a Homelab SOC: One Log Pipeline, Eight Dashboards
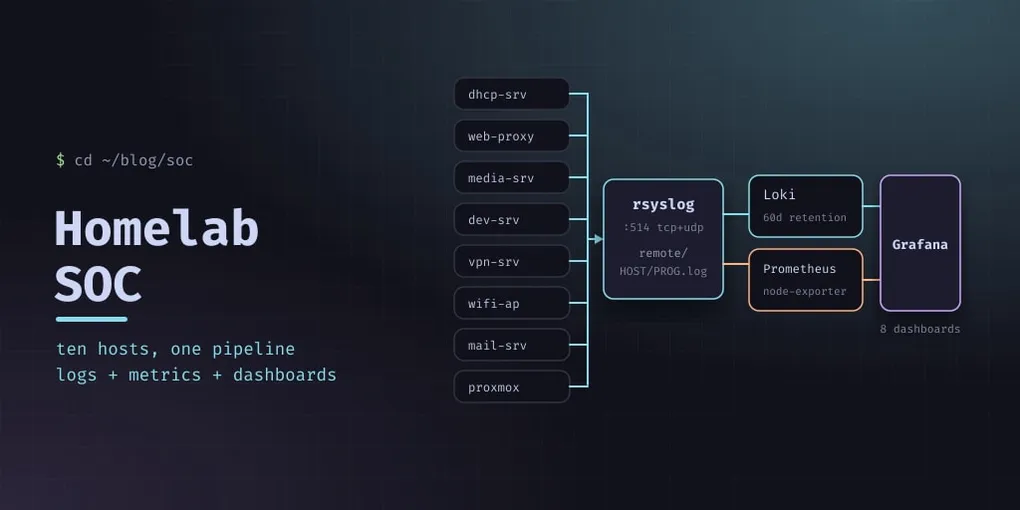
A homelab is a dozen machines, each writing its own logs to its own disk, where nobody ever reads them. The moment something goes wrong you are SSH-ing into containers one at a time, running journalctl and grep, and trying to remember which machine was involved.
This is the pipeline that fixed that: ten machines shipping logs into one place, metrics alongside them, and eight dashboards that I actually open.
The shape
dhcp-srv    ─┐
web-proxy   ─┤
mon-srv     ─┤
media-srv   ─┤   rsyslog            ┌─ Loki ─────┐
dev-srv     ─┼── :514 ──→  mon-srv ─┤            ├─ Grafana
vpn-srv     ─┤    (UDP+TCP)         └─ Prometheus ┘
wifi-ap     ─┤                          ↑
ai-srv      ─┤                          │ node-exporter on every host
mail-srv    ─┘                          │
proxmox ────┘                    Frigate ─┘
Two collectors, because logs and metrics answer different questions and neither replaces the other. Loki holds the why; Prometheus holds the how much, how long, how many. Grafana reads both, and being able to put a metric panel next to a log panel is the entire reason to run both rather than one.
The collector
rsyslog is already installed on every Debian system, which makes it the cheapest possible log agent. On the collector, three lines turn it into a server:
module(load="imudp")
input(type="imudp" port="514")

module(load="imtcp")
input(type="imtcp" port="514")
Both transports, because they fail differently: UDP is fire-and-forget and will silently drop messages under load, TCP blocks the sender when the collector is busy. For a lab, accepting both and letting each client choose is the pragmatic answer.
Then the template — and this is the line that makes the data usable:
$template RemoteLogs,"/var/log/remote/%HOSTNAME%/%PROGRAMNAME%.log"
*.* ?RemoteLogs
Per-host and per-program files. A single remote.log with everything interleaved is a file you will never read; /var/log/remote/web-proxy/nginx.log is one you will. It also makes retention and deletion tractable later.
imklog is deliberately disabled. It reads the kernel ring buffer, which a container cannot access without CAP_SYSLOG — you get permission errors and no kernel messages. On a containerised collector, kernel logs have to come from the Proxmox host instead, which is why the host itself is one of the ten sources.
The directory grows quietly: mine holds 3.4 GB of per-program log files. That is fine, but it is a number to put on a dashboard rather than discover.
The clients
The default client rule is the whole config for most containers:
*.* @@10.99.99.10:514 # @@ = TCP, a single @ would be UDPBut two things do not go through syslog by default, and both matter.
Application logs written to files. nginx writes to /var/log/nginx/*.log, not to syslog, so the client uses imfile:
module(load="imfile")

input(type="imfile"
      File="/var/log/nginx/access.log"
      Tag="nginx-access"
      Severity="info"
      Facility="local6")

input(type="imfile"
      File="/var/log/nginx/error.log"
      Tag="nginx-error"
      Severity="error"
      Facility="local6")
Postfix runs chrooted, so its syslog socket is not where rsyslog is listening. One line bridges it:
$AddUnixListenSocket /var/spool/postfix/dev/logWithout that, the mail server’s own logs never leave the machine — and Postfix is exactly the service whose logs you want centrally when deliverability goes wrong.
Finally, a separate ruleset for the web analytics stream, nginx’s JSON access log:
ruleset(name="fwd_nginx_analytics") {
    action(type="omfwd" target="10.99.99.10" port="514" protocol="tcp")
}
It forwards that file and nothing else: no copy in the local syslog, and its own queue, so a backlog in the highest-volume stream never delays the rest.
Shipping into Loki with Alloy
The collector tails the remote log directory once and pushes to Loki. This used to be Promtail; Alloy is its replacement — same job, one binary that also does metrics and traces:
loki.source.file "remote_logs" {
  targets = [{
    __address__ = "localhost",
    __path__    = "/var/log/remote/*/*.log",
    job         = "remote_syslog",
  }]
  forward_to = [loki.process.remote_logs.receiver]

  file_match { enabled = true }
  legacy_positions_file = "/var/lib/promtail/positions.yaml"
}
Two details worth stealing. file_match makes Alloy discover log files that appear after it started — a new container’s logs get picked up with no reload, which is what you want in a lab where machines come and go. And reusing Promtail’s positions file means migrating does not re-ship every existing log file from the beginning, which on 3.4 GB is the difference between a migration and an incident.
Labels are attached on the way through. Every file gets remote_host and log_file from its path; the web access stream also gets a country, from the GeoLite2 database CrowdSec already downloads, and a traffic label (human, bot or my own):
stage.match {
  selector = "{log_file=\"nginx-analytics.log\"}"

  stage.json  { expressions = { ip = "ip", ua = "ua" } }
  stage.geoip {
    db      = "/var/lib/crowdsec/data/GeoLite2-City.mmdb"
    db_type = "city"
    source  = "ip"
  }
  stage.labels { values = { country = "geoip_country_code" } }
}
A label derived from GeoIP turns “what is hitting the proxy” into a query rather than a grep across rotated files.
Loki itself indexes labels only, not content, which is what makes it cheap: the index stays small, and full-text search is a scan over a bounded time range. The dial that decides your disk budget is retention:
limits_config:
  retention_period: 1440h   # 60 days
Sixty days is a considered number. Long enough to answer “when did this start”, short enough that a chatty container cannot fill the disk before you notice.
Metrics
node-exporter on every machine, scraped by Prometheus — the lab’s own hosts, plus the public server outside the LAN:
scrape_configs:
  - job_name: node
    static_configs:
      - targets: ['10.99.99.1:9100']    # the hypervisor
      - targets: ['10.99.99.10:9100']   # the collector, monitoring itself
      - targets: ['10.99.99.11:9100']   # the reverse proxy
      # …one per container
Include the collector in its own target list. A monitoring stack that cannot show you its own disk filling up is how monitoring dies without anyone noticing.
The machines outside the LAN are scraped the same way, but over TLS with basic auth — node-exporter is a machine-readable inventory of a host (kernel, mounts, services), so it should never be open on a public interface:
  - job_name: node-public
    scheme: https
    basic_auth:
      username: prometheus
      password_file: /etc/prometheus/public-server-exporter.pass
    tls_config:
      ca_file: /etc/prometheus/public-server-exporter.crt
Anything that can answer /metrics joins the same way — including the camera NVR, which exposes Prometheus metrics on a local port and therefore appears in Grafana next to the hosts it runs on.
The dashboards
Eight, each answering a question I actually ask:
| Dashboard | The question |
|---|---|
| Fleet Overview | Is every machine up, and is anything about to run out of disk? |
| Public Server | Is the VPS healthy from outside? |
| Log Analytics | What is being logged most, and what changed today? |
| Security Overview | What is attacking me, and is anything being blocked? |
| CrowdSec Analysis | Which scenarios fire, from which countries, against which service |
| Web Analytics | Who reads the sites — from access logs, no client-side tracking |
| Home WiFi | Which clients joined the wireless network, and what did they resolve? |
| Camera | Are the camera feeds alive and detecting? |
Two of these are worth calling out because they came from data I already had:
Web Analytics is built from nginx access logs in Loki — visitor counts, referrers, status codes, no JavaScript, no third-party analytics, and no cookie banner obligation, because nothing is stored on the visitor’s machine. My own requests are tagged internal by IP when they are ingested and filtered out, and links between my own sites are left out of the referrers.
Home WiFi joins wireless events with DNS queries from the access point container. Client joins and leaves arrive as syslog; lookups of known-malicious domains are reported by a small service watching the resolver’s query log, in logfmt, alert-only — the pipeline records them, nothing is blocked, and the dashboard shows which device asked for what.
Alert-only is a deliberate design choice: a silent blocker that eventually blocks something legitimate is worse than a signal you can investigate.
What made it work
- rsyslog everywhere, because it is already there — no agent to install on ten machines.
- A per-host, per-program file layout on the collector, so the archive is navigable even without the UI.
- TCP by default, UDP only where a lost line does not matter.
- Labels at write time (host, program, geoip), because you cannot add them retroactively.
- Retention set on purpose. The default is not a decision.
- Both sources in one pane. A metric spike next to its own log lines is the whole payoff.
Pitfalls
imklogin a container needsCAP_SYSLOG; without it you get errors and no kernel messages. Ship the hypervisor’s logs instead.- Postfix’s chroot socket. Add
$AddUnixListenSocket /var/spool/postfix/dev/logor the mail logs stay local. - A single combined remote log file. Per-host directories from the start.
- UDP drop under load. If a stream matters, send it over TCP.
- Forgetting
file_matchmeans new log files are invisible until Alloy restarts. - Re-shipping history on a Promtail migration — reuse the positions file.
- Unbounded retention. Index and chunk size only ever grow.