~/blog/homelab-monitoring-grafana-loki-crowdsec
Monitoring Your Homelab with Grafana, Loki, and CrowdSec
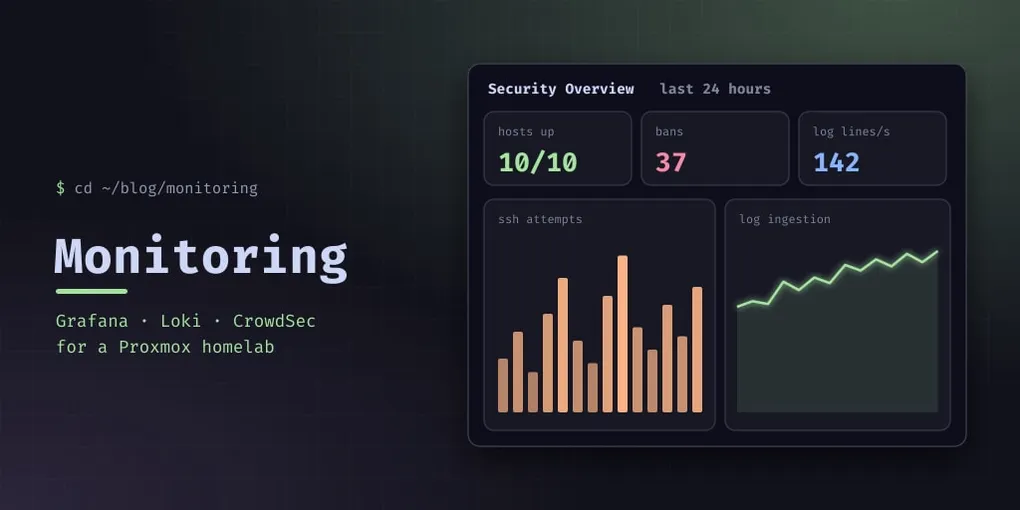
If you run multiple containers, you need observability. When something breaks — or when someone’s probing your services — you want to know about it before it becomes a problem.
My monitoring stack:
- Alloy to collect logs
- Loki to store and query them
- Prometheus with
node-exporterfor metrics - Grafana for dashboards and alerting
- CrowdSec for intrusion detection and crowd-sourced threat intelligence
Everything runs on one small container, and nothing here needs a cloud account.
Architecture
Container A ──rsyslog──→ ┌─────────────────────────────┐
Container B ──rsyslog──→ │  mon-srv                    │
node-exporter ─scrape──→ │  Alloy ──→ Loki ──┐         │
Frigate ──────scrape──→  │  Prometheus ──────┴→ Grafana│
public server ─scrape──→ └─────────────────────────────┘
                                  │
                            CrowdSec (LAPI)
                                  │
                            bouncer (nginx)
                                  ↓
                            block malicious IPs
Containers ship their logs with rsyslog to a central directory, Alloy tails that directory and pushes to Loki, and Prometheus scrapes node-exporter on every machine. Grafana reads both. CrowdSec parses the same logs for attack patterns, shares anonymised data with the community, and blocks repeat offenders through a bouncer on the reverse proxy.
Logs: rsyslog → Alloy → Loki
The first hop is rsyslog. Rather than installing a log shipper on every container, each one forwards its syslog to the monitoring container on port 514, which writes it under /var/log/remote/<host>/*.log. One rule per container, and every log lands in one place.
Loki is the store. It’s a log aggregation system from Grafana Labs that indexes metadata only — labels, not the log content — which is what makes it cheap enough to run next to everything else.
wget https://github.com/grafana/loki/releases/latest/download/loki-linux-amd64.deb
dpkg -i loki-linux-amd64.deb
Loki 3.x config (/etc/loki-config.yaml), cut down to what matters:
auth_enabled: false
server:
  http_listen_port: 3100
common:
  path_prefix: /var/lib/loki
storage_config:
  boltdb_shipper:
    active_index_directory: /var/lib/loki/boltdb-shipper-active
  filesystem:
    directory: /var/lib/loki/chunks
schema_config:
  configs:
    - from: 2024-01-01
      store: boltdb-shipper
      object_store: filesystem
      schema: v11
      index:
        prefix: index_
        period: 24h
limits_config:
  retention_period: 1440h   # 60 days
The retention_period is the line that decides how much disk the whole thing eats, and it’s the one to think about first: log volume grows silently, and 60 days of a chatty container is a lot of disk. Set it deliberately, and put the data directory somewhere you actually monitor.
Collecting with Alloy
This used to be Promtail. Grafana deprecated Promtail in favour of Grafana Alloy — same job, one binary that also handles metrics and traces — so the migration is mostly configuration. Alloy’s own picture of the job (/etc/alloy/config.alloy):
loki.source.file "remote_logs" {
  targets = [{
    __address__ = "localhost",
    __path__    = "/var/log/remote/*/*.log",
    job         = "remote_syslog",
  }]
  forward_to = [loki.process.remote_logs.receiver]

  file_match { enabled = true }
  legacy_positions_file = "/var/lib/promtail/positions.yaml"
}

loki.write "default" {
  endpoint { url = "http://localhost:3100/loki/api/v1/push" }
}
Two things worth copying: file_match makes Alloy discover log files that appear after it started, so a new container’s logs are picked up without a reload; and reusing Promtail’s positions.yaml means the migration doesn’t re-ship every log file from the beginning.
The middle stage, loki.process, is where labels are attached before the write — that’s what makes logs queryable later:
loki.process "remote_logs" {
  forward_to = [loki.write.default.receiver]

  stage.labels {
    values = { traffic = "", country = "geoip_country_code" }
  }
}
A label like country turns “show me what’s hitting the proxy” into a one-line query instead of a grep.
Metrics: Prometheus + node-exporter
Logs tell you what happened; metrics tell you what is happening. node-exporter on each machine exposes CPU, memory, disk, network and filesystem stats on :9100, and Prometheus scrapes them:
scrape_configs:
  - job_name: node
    static_configs:
      - targets: ['10.99.99.1:9100']    # the Proxmox host
      - targets: ['10.99.99.10:9100']   # the monitoring container itself
      - targets: ['10.99.99.11:9100']   # the reverse proxy
      - targets: ['10.99.99.25:9100']   # the VPN controller
Include the monitoring container in its own targets. A monitoring stack that can’t show you its own disk filling up is how monitoring dies quietly.
Machines outside the LAN are scraped the same way, but they need two things: the scrape has to survive the public internet, and port 9100 must not be open to the world. I expose it over TLS with basic auth, and Prometheus carries the credentials:
  - job_name: node-public
    scheme: https
    basic_auth:
      username: prometheus
      password_file: /etc/prometheus/public-server-exporter.pass
    tls_config:
      ca_file: /etc/prometheus/public-server-exporter.crt
    static_configs:
      - targets: ['mon.example.org:9100']
Otherwise, node-exporter is a machine-readable inventory of your host — kernel version, mount points, running services — published to anyone who finds the port. On a public server, never leave it unauthenticated.
The camera runs the same way. I use Frigate for object detection, and it exposes Prometheus metrics, so camera health sits in the same place as everything else:
  - job_name: frigate
    static_configs:
      - targets: ['127.0.0.1:5000']
That’s the whole trick with Prometheus: anything that can answer /metrics is a first-class citizen. Cameras, exporters, and a five-line container of your own all look the same to Grafana.
Grafana
Grafana is provisioned with both data sources — Loki for logs, Prometheus for metrics:
apiVersion: 1
datasources:
  - name: Loki
    type: loki
    url: http://localhost:3100
  - name: Prometheus
    type: prometheus
    url: http://127.0.0.1:9090
Being able to pivot between them is the reason to run both. When a metric spikes, the log panel next to it usually says why — in my experience that correlation is what actually saves time, not either source on its own.
Dashboards I keep:
- Fleet Overview — is every machine up, and is anything about to run out of disk?
- Security Overview — what’s attacking me, and is anything being blocked?
- CrowdSec Analysis — which scenarios fire, from which countries, against which service
- Log Analytics — what’s being logged most, and what changed today?
- Web Analytics — who reads the sites, built from access logs rather than client-side tracking
- Public Server — the machine outside the LAN
- Home WiFi — which clients joined the wireless network, and what they resolved
- Camera — are the feeds alive and detecting?
Alert Rules
Grafana can reach email, Slack, a webhook, or a self-hosted push service. I have rules for:
- SSH brute force attempts above a threshold
- Certificate renewing within 7 days
- A container down for more than 5 minutes
- Disk usage above 85%
- A camera feed going offline
An alert nobody sees is worse than no alert: it teaches you to ignore the channel. I’d rather have four rules that reach me than forty that don’t.
CrowdSec
CrowdSec is a community-driven IPS. It detects attacks by parsing logs, then blocks the offending IP through a bouncer.
The setup:
- LAPI (Local API) — processes alerts and serves decisions
- Scenarios — detection rules (SSH brute force, HTTP scanning, port scans)
- Bouncers — the components that actually block (iptables, nginx, nftables)
It reads the same logs as everything else, which is the point of centralising them in the first place: one collector, three consumers — Loki for history, Grafana for graphs, CrowdSec for decisions.
cscli alerts list
cscli decisions list
cscli metrics
The community blocklist is what makes CrowdSec more than an IPS: when someone attacks any CrowdSec user, everyone else benefits from that intelligence — no manual threat feed required.
Putting It Together
All of it runs on one container (mon-srv) with 3 GB of RAM, currently using about 1.5 GB with the cameras included:
| Service | Memory |
|---|---|
| Grafana | ~226 MB |
| Prometheus | ~135 MB |
| Loki | ~134 MB |
| CrowdSec | ~114 MB |
| Alloy | ~106 MB |
The numbers that grow are on disk, not in RAM: Loki was holding 3.4 GB of logs at the time of writing and Prometheus 608 MB of metrics. Both are bounded by retention — which is exactly why you want retention set on purpose rather than left at whatever the default is.
For a lab with 10-15 containers, this stack is more than sufficient and entirely free. In production you’d add load balancers, replication and long-term object storage, but for a homelab it works beautifully out of the box.
Updated October 2026: the log shipper is now Grafana Alloy rather than Promtail, and the metrics side — Prometheus, node-exporter and the camera metrics — is now part of the write-up rather than implied.